Guide to write the Configuration Files
This guide explains how to write configurations files for Hardy
1. Configuration file for the Transformations
Here you will find an introduction and explanation on how to construct the transformations configuration file.
This configuration file can be split into 3 main sections.
First, at the top of the file it is always a good idea to add a comment section with the basic organization of the raw data files. Here you can indicate which quantity is contained in each column.

If you look at the image on the right, the yellow circle is pointing towards thsi information section. In the case for a Small angle Scattering dataset, ther are only two quantities : the scattering vector q and the scattering intensity I(q).
Next, the purple box indicates an example of the transformation command list. The names for transformation must be listed under tform_command_list. The actual name of each transformation run can be any string the user prefers to use for identifying the run. In this case, the transformations used to modify the data were used as run name.

Once the list of runs is indicated, the next section of the configuration file allow the user to fully define the :
- Raw Data Column Number:
- Transformation Name
- Plot Code
The rules for plotting must be defined in tform_command_dict. The header of each entry in the dictionary corresponds to the transformation name which should be same as entered in the tform_command_list. The operations performed on the data are defined as lists under this entry. The Raw Data Column Number corresponds to the column number according to the data in csv file. Transformation Name is the operation that needs to be performed on this column and Plot Code corresponds to the color and orientation of the plot in final image that is to be read by machine learning algorithm.
As many as six definitions can be entered under transformation command of dictionary. Each command follows the structure of [column_number, mathematical operation, plotting_value].
The scheme for plotting_values is as follow:
0. Red on x-axis
1. Green on x-axis
2. Blue on x-axis
3. Red on y-axis
4. Green on y-axis
5. Blue on y-axis
Currently supported mathematical operations are as follows:
raw: returns raw data without performing any operationexp: exponentialnlog: natural loglog10: logarithm tranformation with base 10reciprocal: reciprocalcumsum: cumulative sumderivative_1d: Differential with respect to 1 dimensionderivative_2d: 2-D differentiationpower: can be used for array multiplication or to take user defined power for array
2. Configuration file for Hyperparameter Search
Instructions for using Convolutional Neural Network Configuration files
Each configuration file in the recognition folder provides the example Hyperparameter space over which Neural Network model is built. The configuration file can be placed anywhere in the system and relative path must be passed as argument in run_hardy.hardy_multi_transform module
Configuration file for CNN
This file provides the input information along with the Hyperparameter space for Neural Network.
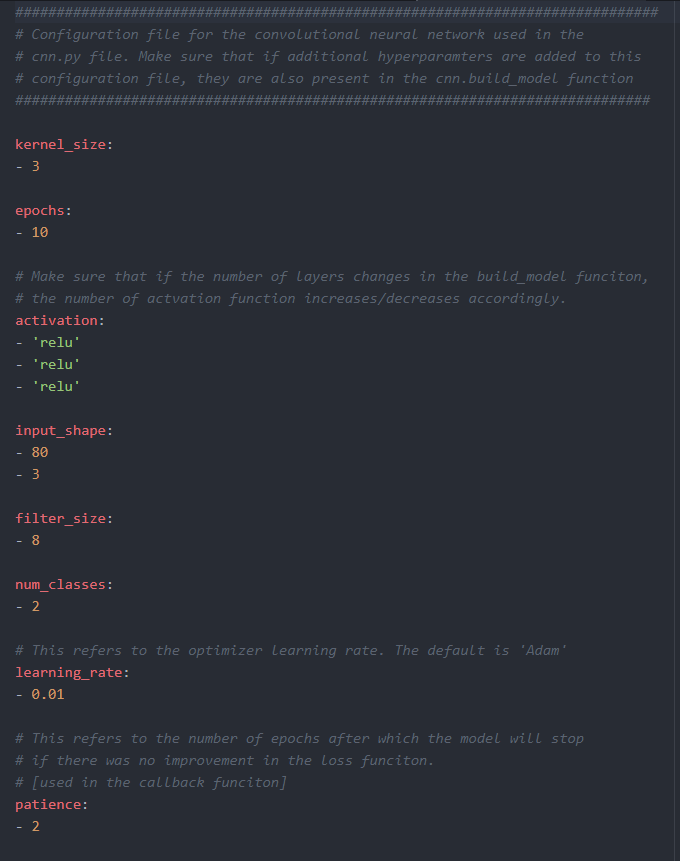
- cnn_config.yaml
A configuration file which contains the hyperparameters to use in the single convolutional neural network. The configuration file is easy to fill out and interact with.
Note: Make sure that the hyperparameters found in the config. file are also used in the cnn model
Currently supported keys for the cnn_config.yaml includes:
-> kernel_size

-> epochs

-> activation

-> input_shape

-> filter_size

-> num_classes

-> learning_rate

-> patience
Note: All this information must be entered to successfully execute the Machine Learning Step. The detailed information about the options for keys can be found in the config file itself.
Configuration file for Hyperparameter Optimization
- tuner_config.yaml
A configuration file containing the hyperparamter search space for the tuning step. This should substitute the single cnn model.
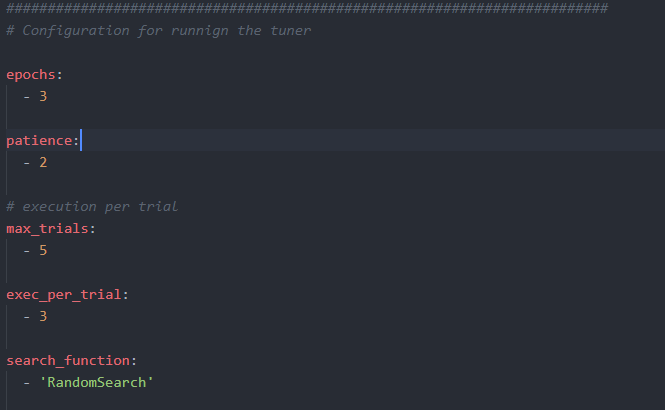
The first part deals with defining the tuner run:
For definition of tuner run, following keys are currently supported:
-> num_classes

-> epochs

-> patience

-> input_shape

-> max_trials

-> exec_per_trial

-> search_function
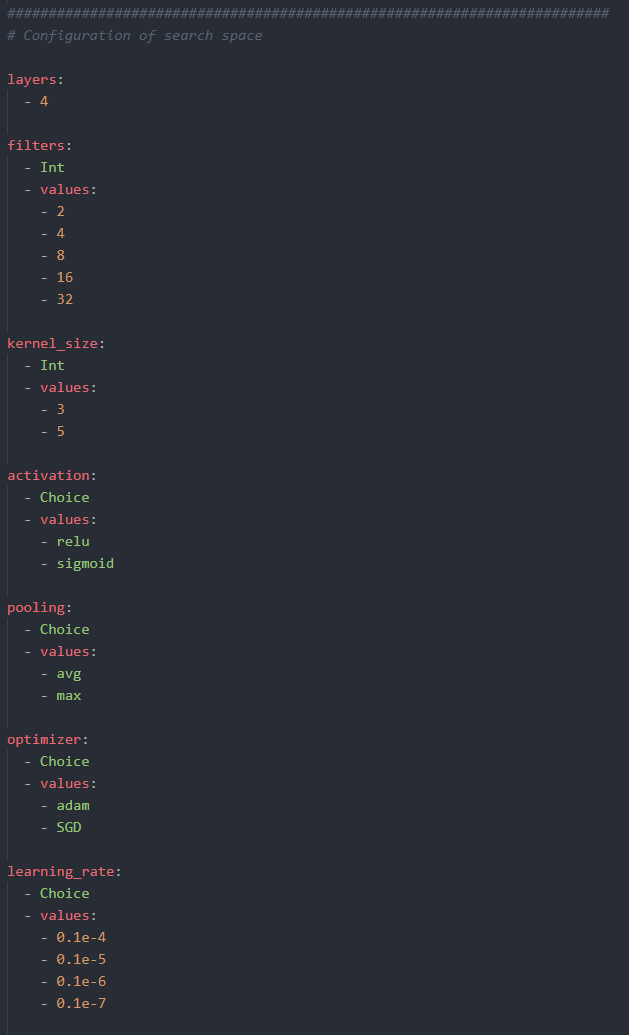
The second section, deals with the actual hyperparameter search space to use in the tuning operation:
For hyperparameters search space, following keys are currently supported:
-> layers

-> filters

-> kernel_size

-> activation

-> pooling

-> optimizer

-> learning_rate
Note: All this information must be entered to successfully execute the Hyperparameter Step. The detailed information about the options for keys can be found in the config file itself.