RGB vs. Cartesian Coordinate Representation
To compare the performance of Hyperparameter tuning on the type of representation, HARDy provides easy access to use to control the representation of transformed data in the Convolutional Neural Network (CNN)
The two representations after numerical transformations are shown in the image below: 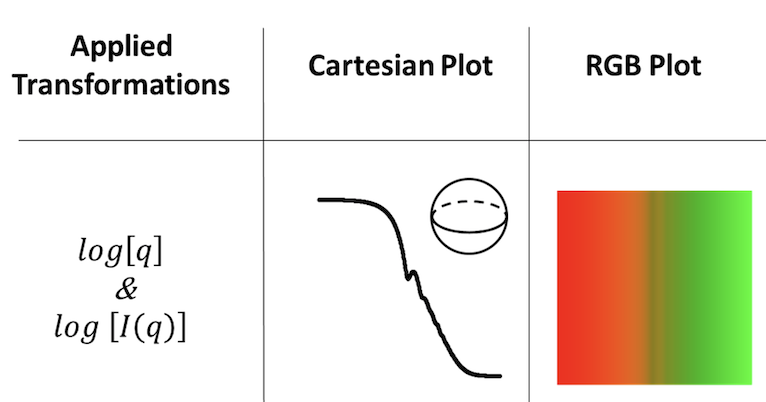
The representation can be controlled through plot_format argument in the hardy_main
Using RGB Representation
Following code will execute HARDy using RGB representation
run.hardy_main(raw_data_path, tform_config_path, classifier_config_path, batch_size=64,
scale=0.2, num_test_files_class=750, target_size=(100, 100), iterator_mode='arrays',
classifier='tuner', n_threads=1, classes=['class_1', 'class_2', 'class_3'], plot_format='RGBrgb`
project_name='my_project_name')
if the plot_format='RGBrgb', the RGB images will be fed into the neural network
Using Cartesian Representation
Any other string value other than RGBrgb will prompt the HARDy to use cartesian representation. The example code will then be:
run.hardy_main(raw_data_path, tform_config_path, classifier_config_path, batch_size=64,
scale=0.2, num_test_files_class=750, target_size=(100, 100), iterator_mode='arrays',
classifier='tuner', n_threads=1, classes=['class_1', 'class_2', 'class_3'], plot_format='cart`
project_name='my_project_name')
By default, the plot_format is kept as ``RGBrgb``